How to Measure Shooting Groups: Extreme Spread, Mean Radius and MOA
Centre-to-centre measurement step by step, the real difference between extreme spread and mean radius, and how many shots a group actually needs before the number means anything.
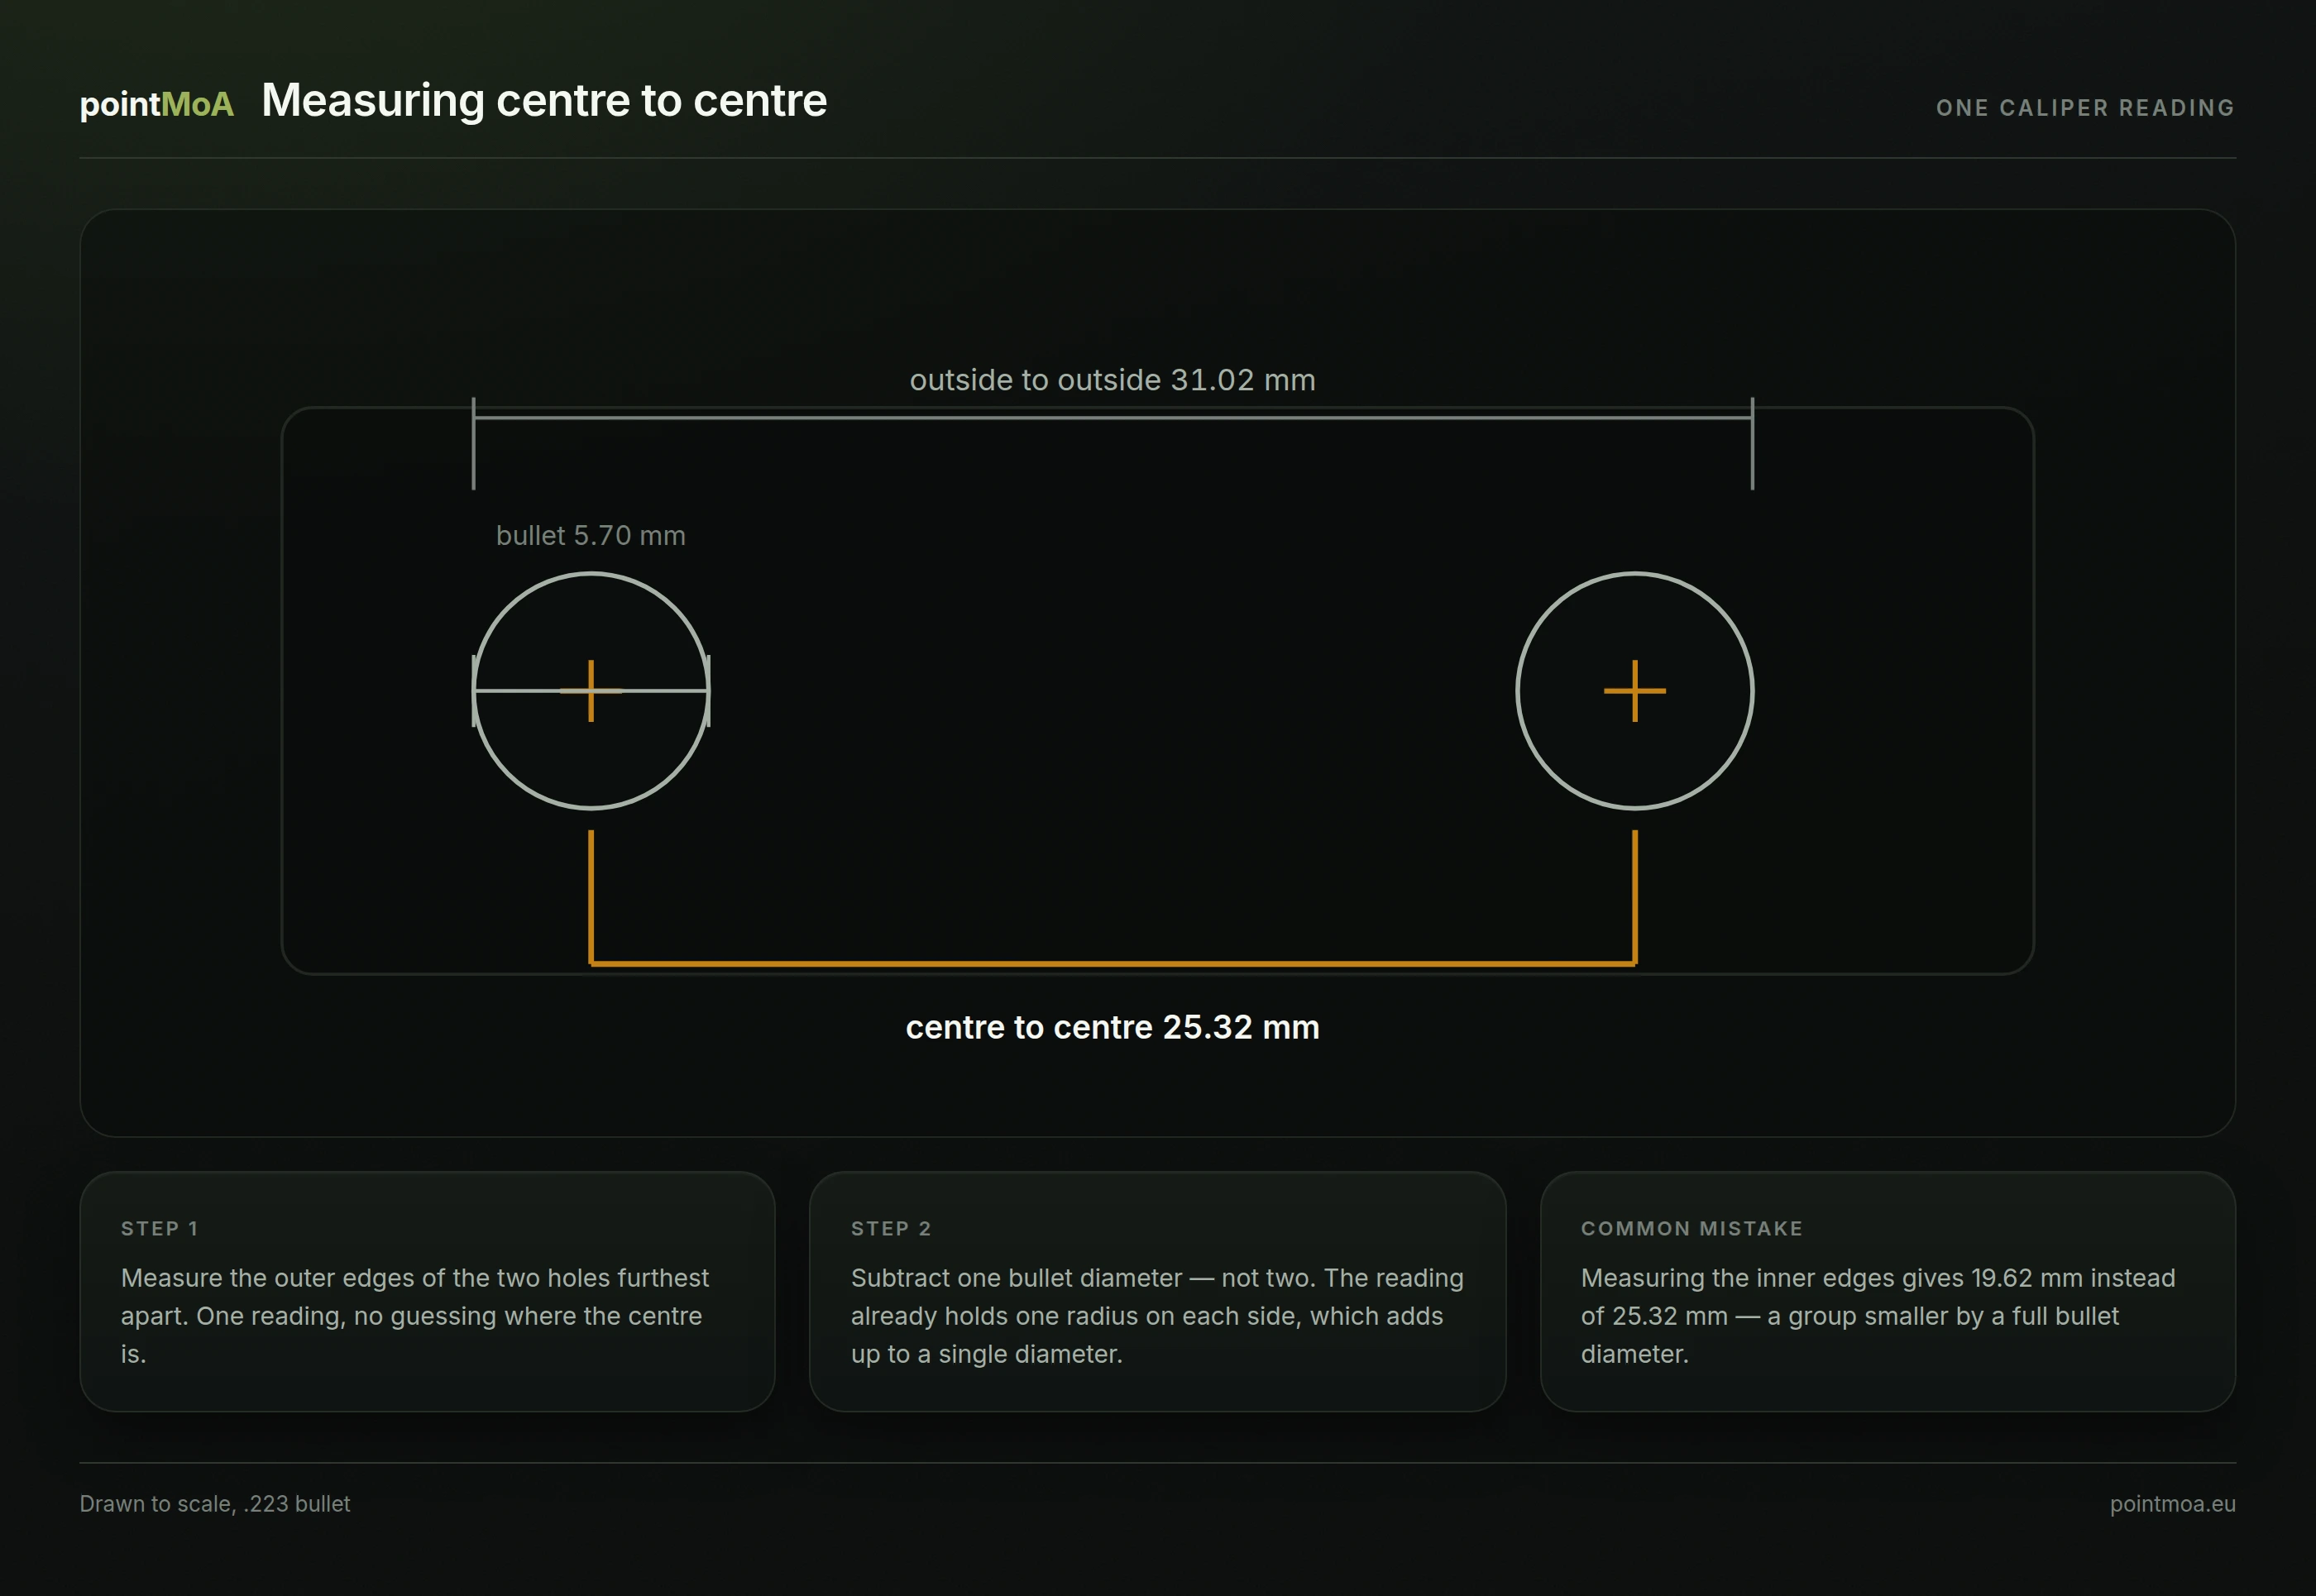
Group size is measured from the centre of one hole to the centre of another. With a caliper that is a single reading: measure the outside edges of the two holes furthest apart, then subtract one bullet diameter. Report the result in inches or millimetres — or divide by the distance and report it in MOA.
That is all you need at the range. The rest of this article is about why that one number can lie to you, and what to do so it lies less.
What group size actually measures
Group size is repeatability, not accuracy. A group can sit four inches away from your point of aim and still be tight: the rifle, the load and the shooter are doing the same thing every time, the zero is simply off. The reverse happens too — shots scattered around the ten ring look good on the scorecard and bad as a measure of precision.
The two things are measured separately, and this article deals with only one of them: how closely the holes sit relative to each other. Where the group centre sits relative to your aim is the subject of the zeroing guide; the terms themselves are separated in POA vs POI.
Centre-to-centre, step by step
- Find the two holes furthest apart. They are not always the outermost pair horizontally — check the diagonals too.
- Measure outside edge to outside edge. One caliper jaw on the far edge of one hole, the other jaw on the far edge of the second.
- Subtract one bullet diameter. The reading contains one radius on each side, and two radii make a single diameter.
For a .223 bullet (0.224 in, 5.70 mm), a reading of 31.02 mm gives 25.32 mm — just under one inch — centre to centre.
The method works because the hole is roughly round and roughly the size of the bullet. Both of those "roughly" are sources of error we will come back to.
Never measure the inside edges. It is the most common mistake and it always errs the same way: it understates the group by a full bullet diameter. On a 25 mm group with a .223 that is a 22% flattery.
Extreme spread
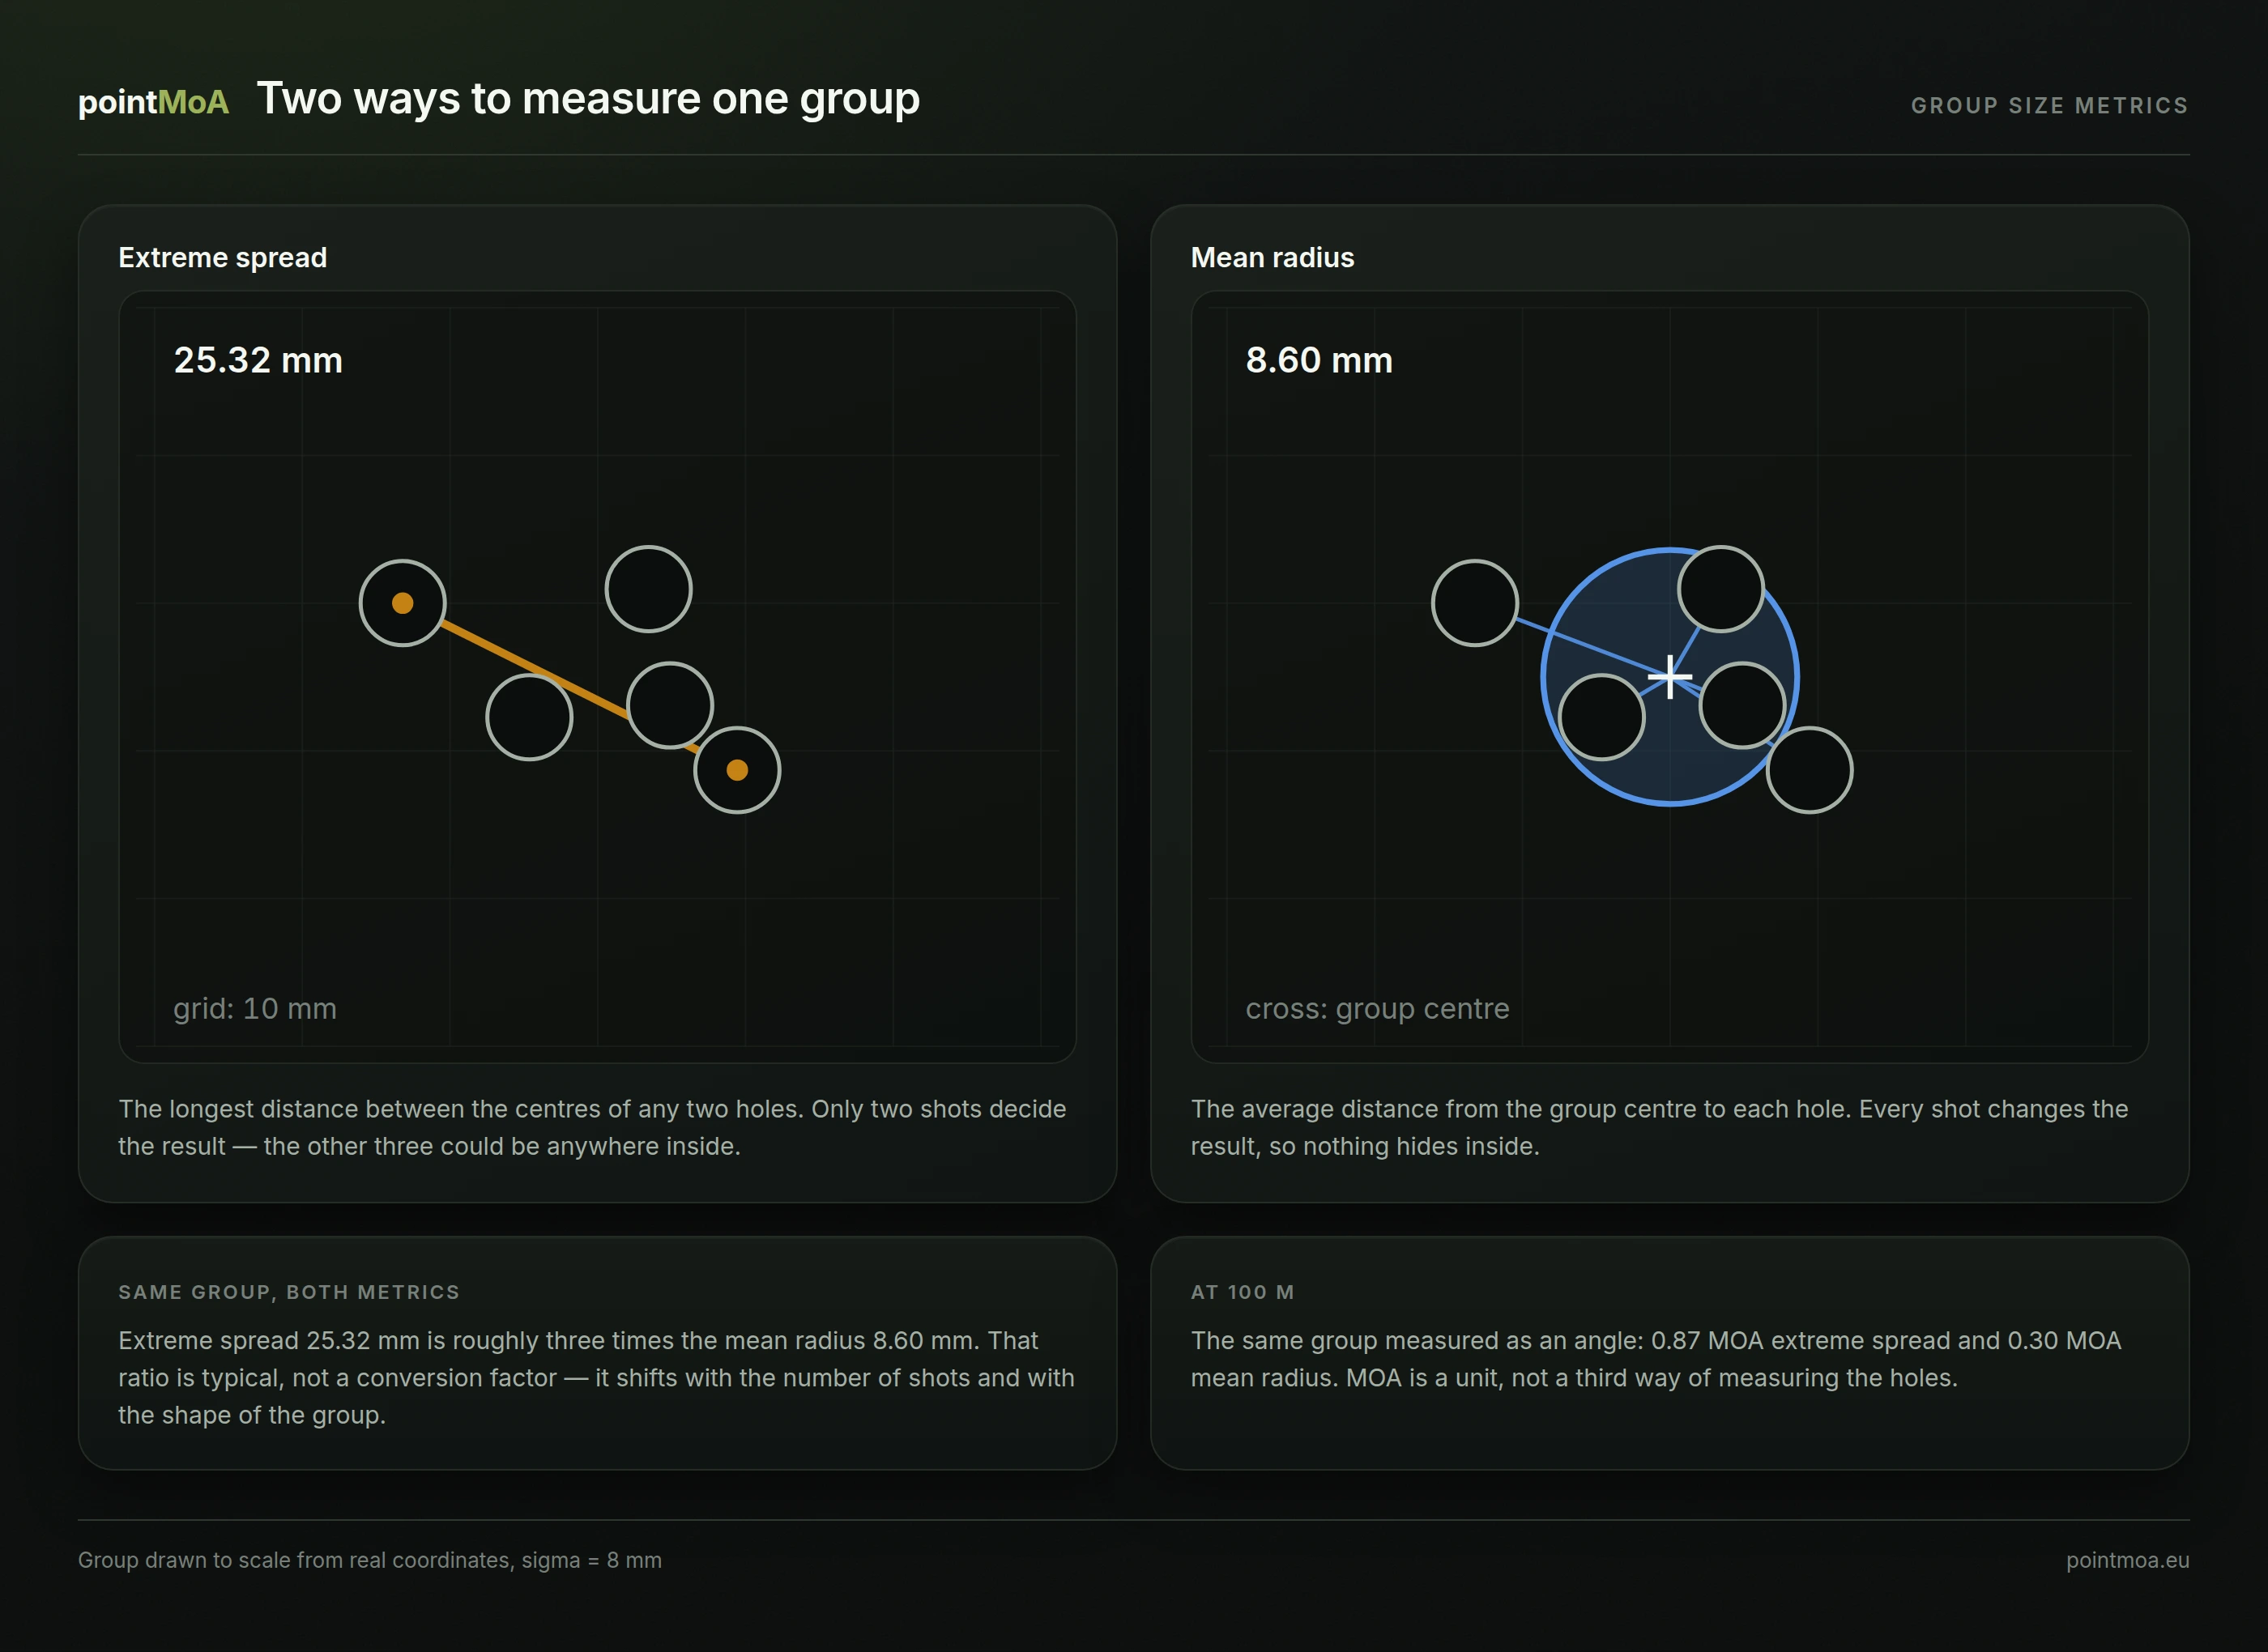
Extreme spread is the largest centre-to-centre distance between any two holes in the group. It is the number people mean when they say "a one-inch group".
Its strength is simplicity: one measurement, one number, and everybody knows what it refers to.
The weakness is worse than it looks. Exactly two shots decide the result — the two worst ones. The rest can sit anywhere inside without moving the number. A group with three shots in one ragged hole and two wide gets the same score as a group spread evenly over the same width.
There is a second weakness that only shows up in comparisons, and it is the subject of the section below: extreme spread grows with the number of shots fired, even when the rifle behaves identically.
Mean radius
Mean radius is the average distance from each hole to the centre of the group. The group centre is the plain average of all hit coordinates — the mean point of impact, or MPI.
It takes three steps:
- Average the horizontal and vertical coordinates of every hole. That is the group centre.
- Measure the distance from that centre to each hole individually.
- Average those distances.
For the group in the illustration that comes to 8.60 mm (0.339 in) against an extreme spread of 25.32 mm. Every shot moves the result, so nothing hides in the middle.
By hand it is tedious — five measurements instead of one, from a centre you had to estimate. That is why mean radius lost to its simpler rival for decades, despite being the better measure. It only became practical once people started marking hits on a photograph.
MOA is a unit, not a third method
MOA is not another way of measuring holes. It is an angular unit you convert an existing linear measurement into:
group size [MOA] = size [in] ÷ (distance [yd] ÷ 100 × 1.047)
At 100 yards one minute of angle subtends 1.047 in; at 100 m it subtends 29.089 mm. Our group of 25.32 mm is therefore 0.87 MOA at 100 m, and its mean radius of 8.60 mm is 0.30 MOA. Both numbers describe the same group — what differs is what they measure, not the unit.
Where 1.047 in comes from, and how MOA differs from MRAD, is covered separately in MOA and MRAD explained. The conversion itself step by step — with the error budget and the number of digits a single group can support — is in How to calculate group size in MOA.
Which measure for which job
| Extreme spread | Mean radius | |
|---|---|---|
| What it measures | the two worst shots | every shot |
| By hand | one caliper reading | one measurement per hole |
| Sensitivity to a single flier | very high | moderate |
| Comparable across different shot counts | not at all | good |
| Typical use | a quick call at the range, conversation | load comparison, tracking progress |
Neither is "the true one". Extreme spread answers "how bad can it get"; mean radius answers "how is it usually".
Both lose the same thing: direction. A vertically strung group and a round one can share an identical extreme spread and still differ in shape plainly enough to see. Shape and direction come from ellipses — the subject of the article on P50 and P90 — while the heatmap shows the distribution with no assumption about shape at all.
How many shots before the number means anything
This is the part that is easy to skip and that decides everything else.
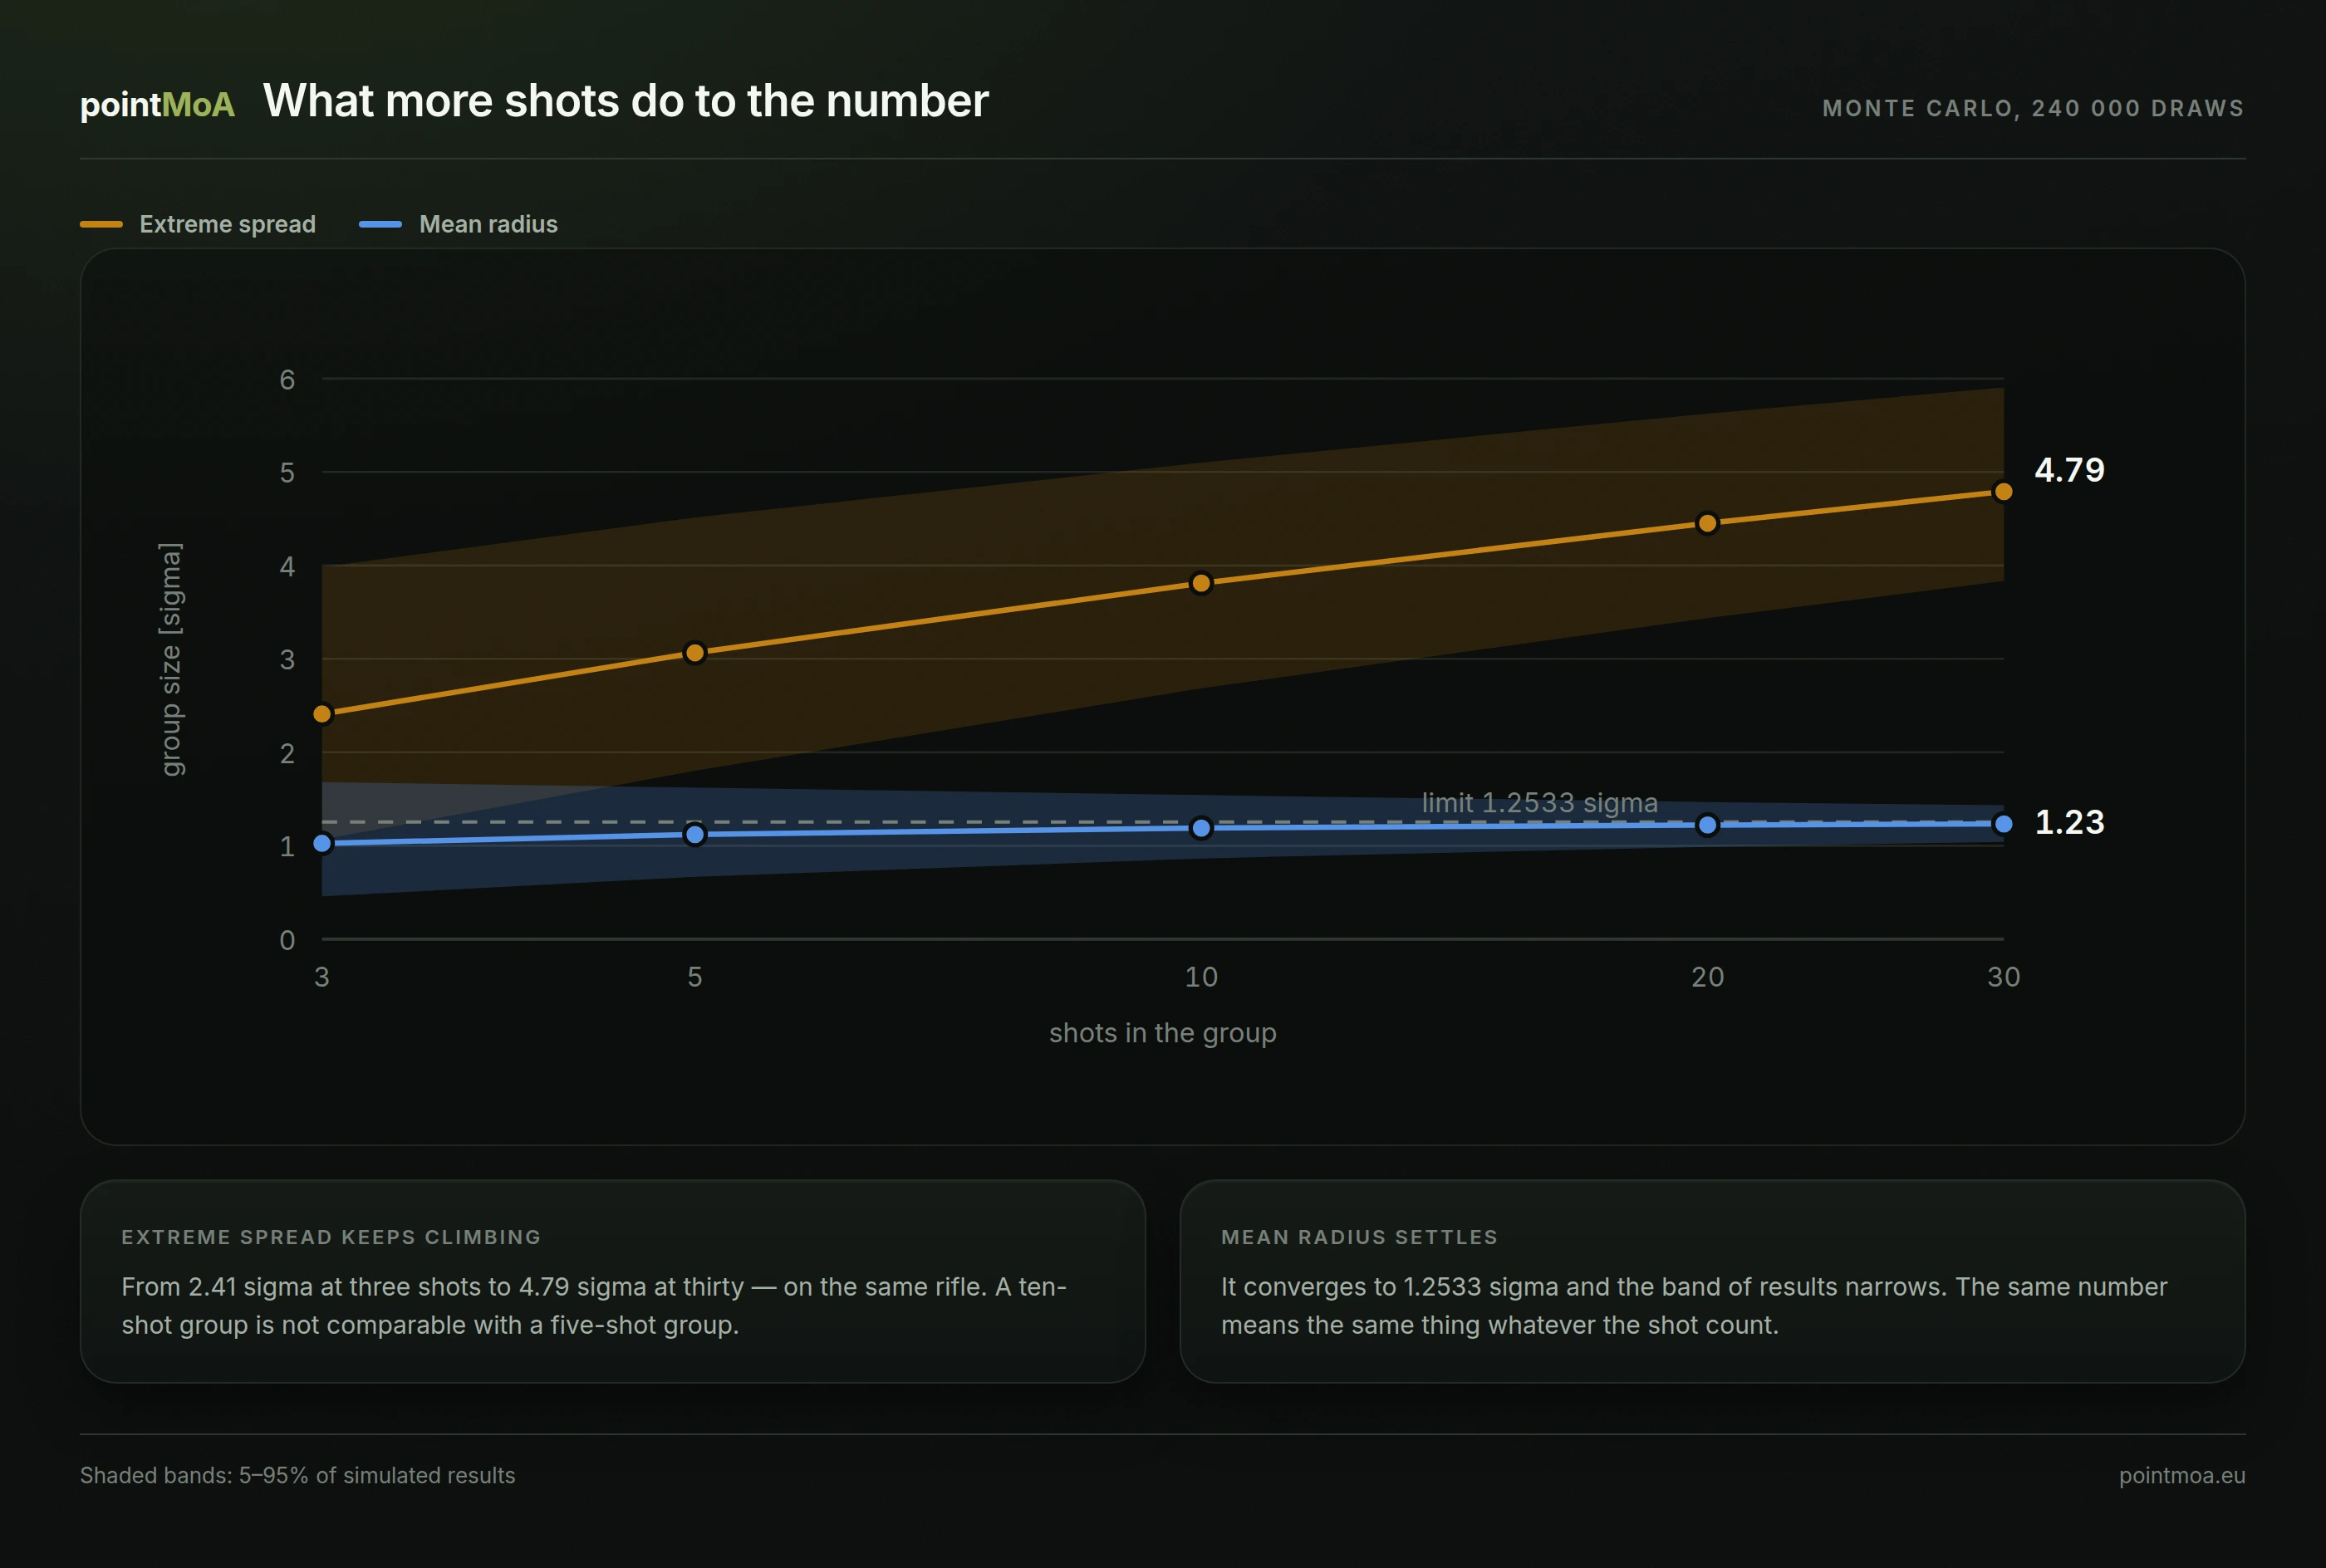
We simulated it: 240,000 draws for each shot count, with hits taken from a two-dimensional normal distribution of standard deviation σ. Results are expressed in σ, so they do not depend on calibre or distance.
Two conclusions follow, and both are practical.
Extreme spread grows with shot count. From 2.41 σ at three shots to 4.79 σ at thirty — same rifle, same ammunition, nothing changed but the number of trigger presses. The more you shoot, the likelier you are to catch an extreme pair. Which means a three-shot group cannot be compared with a ten-shot group — and that is almost exactly how groups get compared online.
Mean radius settles. It converges on 1.2533 σ and gets there quickly: by ten shots it is within 5% of the limit. More precisely, the expected mean radius of an n-shot group is:
E[mean radius] = σ × √(π/2) × √(1 − 1/n)
Our simulation matches that formula at every n to four decimal places. The practical consequence: the same number means the same thing however many shots you fired.
How badly a single group can mislead
The average is only half the story; what matters is how far one result strays from it. Take two configurations where one is objectively 20% worse, and ask how often the worse one wins a single head-to-head comparison:
| Shots per group | Worse wins on extreme spread | Worse wins on mean radius |
|---|---|---|
| 3 | 36.7% | 36.6% |
| 5 | 31.8% | 31.2% |
| 10 | 25.3% | 23.0% |
| 20 | 19.4% | 14.2% |
At five shots the worse load wins nearly one comparison in three. That is not bad luck or a bad day — it is ordinary small-sample behaviour. One group settles nothing.
Note something else in that table: at five shots mean radius is barely steadier than extreme spread (31.2% against 31.8%). Its advantage grows with hit count and is clear by twenty. The often-repeated claim that mean radius simply solves the small-sample problem is not true. What it does solve, from the very first shot, is comparability.
How many groups to average
To judge a load to within 10% relative error you need roughly eight five-shot groups on extreme spread, or seven on mean radius. Forty rounds for one answer — that is the price of the confidence people claim after a single good group.
Mind the scope of these figures: the simulation assumes a normal distribution, no fliers, no shooter error and perfect measurement. Real groups are more variable, not less. Treat these as a floor on the uncertainty, not a realistic estimate of it.
How many shots it takes to establish a zero is a different question — there what matters is the accuracy of the group centre, not its size. The zeroing guide answers that one.
Common measurement problems
Overlapping holes. When two holes merge you cannot locate two centres. For extreme spread it usually does not matter — a touching pair is rarely the extreme one. For mean radius, either separate them or measure the group without them and record how many shots the result covers.
Torn paper. At higher velocities, and on a soft backer, the hole can be noticeably larger than the bullet and ragged. Subtracting the nominal diameter then overstates the group. A firmer backer helps, as does measuring to the middle of the tear rather than its edge.
Fliers. A shot away from the rest is information, not rubbish. Dropping it because "that one was me" turns a measurement into a story about how good it could have been. If you genuinely suspect an external cause — a gust, a badly seated round — record it alongside the result instead of quietly deleting the hole.
Uncertain distance. An MOA figure is only as good as your knowledge of the range. A 10% error in distance is a 10% error in the angular result.
By hand or from a photograph
A caliper is enough for extreme spread. For mean radius, density maps or session-to-session comparison, doing it by hand stops being worth the time.
In the pointMoA app you mark the hits on a photo of the target and the metrics follow the same definitions described here: extreme spread as the largest distance between two hit centres, mean radius as the average distance from the MPI. No bullet diameter is subtracted — you are marking centres, so there is nothing for the step-3 correction to fix.
Both measures need at least two hits. The distribution analysis — the P50 and P90 ellipses — needs at least three, and is flagged as a small sample below ten, for the reasons the chart above makes visible.
The short version
- Measure centre to centre: outside edges minus one bullet diameter.
- Extreme spread is set by the two worst shots; mean radius by all of them.
- MOA is a unit, not a method; one minute spans 1.047 in at 100 yards.
- Extreme spread grows with shot count, so groups of different sizes must not be compared.
- One group settles nothing: at five shots the worse load wins nearly a third of comparisons.
Frequently asked questions
Edge to edge or centre to centre? Centre to centre. Measuring the outside edges is just the way to get there — after subtracting one bullet diameter. Measuring the inside edges understates the group by a full diameter.
How many shots should a group have? Five for a quick call. Ten or more — ideally several groups averaged — for comparing loads or tracking progress. Three shots mostly measure luck.
Is 0.5 MOA a good result? It depends how many shots and how many groups are behind it. A single three-shot 0.5 MOA group and ten ten-shot groups averaging 0.5 MOA are two entirely different claims about a rifle.
Can extreme spread be converted to mean radius? There is no dependable conversion. For five-shot groups the ratio averages about 2.7, but it shifts with shot count and group shape, and for any single group it can be well off — our worked example came out at 2.94.
May a flier be discarded? Only when you know the external cause, and always with a note. Dropping the worst shot because "it does not count" systematically flatters the rifle.
If you would rather have both measures without a caliper and a spreadsheet: in the pointMoA app you mark the hits on a photo of the target and extreme spread, mean radius and MPI are computed straight away — in millimetres and in MOA.