P50 and P90 in shooting — what the dispersion ellipses tell you
In pointMoA, P50 and P90 are ellipses fitted to your hits — not radii and not CEP. Where they come from, why P90 is always 1.82 times larger, and how many hits it takes before the shape of the ellipse means anything.
In pointMoA, P50 and P90 are ellipses rather than circles, and the app reports their full axes rather than radii. P50 covers half and P90 nine tenths of the fitted model of your shot distribution. Both come from the covariance matrix of the hit coordinates, which means they carry something no single number can: size, shape and direction of the dispersion at once.
Neither is a measurement of your group. Both are a model fitted to it — and at five shots that model can mislead you badly. This article covers both halves of that sentence.
Where the ellipses come from
Four steps, and none of them needs anything beyond the coordinates of the holes.
- The centre. The arithmetic mean of the positions — the same mean point of impact used when measuring the shift against your point of aim.
- The covariance matrix. Three numbers: the horizontal variance σ²ₓ, the vertical variance σ²ᵧ and the covariance σₓᵧ, each divided by n − 1, where n is the number of hits. The covariance says whether horizontal departures travel with vertical ones — it is what tilts the ellipse.
- The axes. Those three numbers yield two perpendicular directions, one of largest and one of smallest dispersion, with a variance for each.
- The scale. Semi-axis = √(variance × q), where q is the quantile of the chi-square distribution with two degrees of freedom. The app doubles the semi-axes, because it displays full axes.
The quantiles are not looked up in a table — with two degrees of freedom they have the closed form q = −2·ln(1 − p):
| Level | q | Value |
|---|---|---|
| P50 | −2·ln(0.5) = 2·ln2 | 1.386294 |
| P90 | −2·ln(0.1) = 2·ln10 | 4.605170 |
A worked example
Five shots at 100 m, coordinates in millimetres relative to the centre of the target: (−17, −17), (−15, 18), (−2, −3), (9, −16), (18, 8).
The mean lands at (−1.4, −2.0). The variances, divided by 4, come to σ²ₓ = 228.30 mm², σ²ᵧ = 230.50 mm², σₓᵧ = 2.75 mm². The dispersion is therefore nearly equal in both directions and nearly uncorrelated — the larger eigenvalue is 232.36 mm², the smaller 226.44 mm².
P50 semi-axis = √(232.36 × 1.386294) = 17.95 mm, so the major axis is 35.9 mm. The other semi-axis is √(226.44 × 1.386294) = 17.72 mm, so the minor axis is 35.4 mm. That is exactly what the app shows: 35.9 × 35.4 mm, or 1.23 × 1.22 MOA. Elongation 1.01 : 1, axis angle 55.9° — a circle in all but name, and with a direction that means nothing.
Why an ellipse and not a circle
Because groups are rarely round, and the direction they spill in is information. The two groups below have exactly the same extreme spread: 43.0 mm, or 1.48 MOA at 100 m.
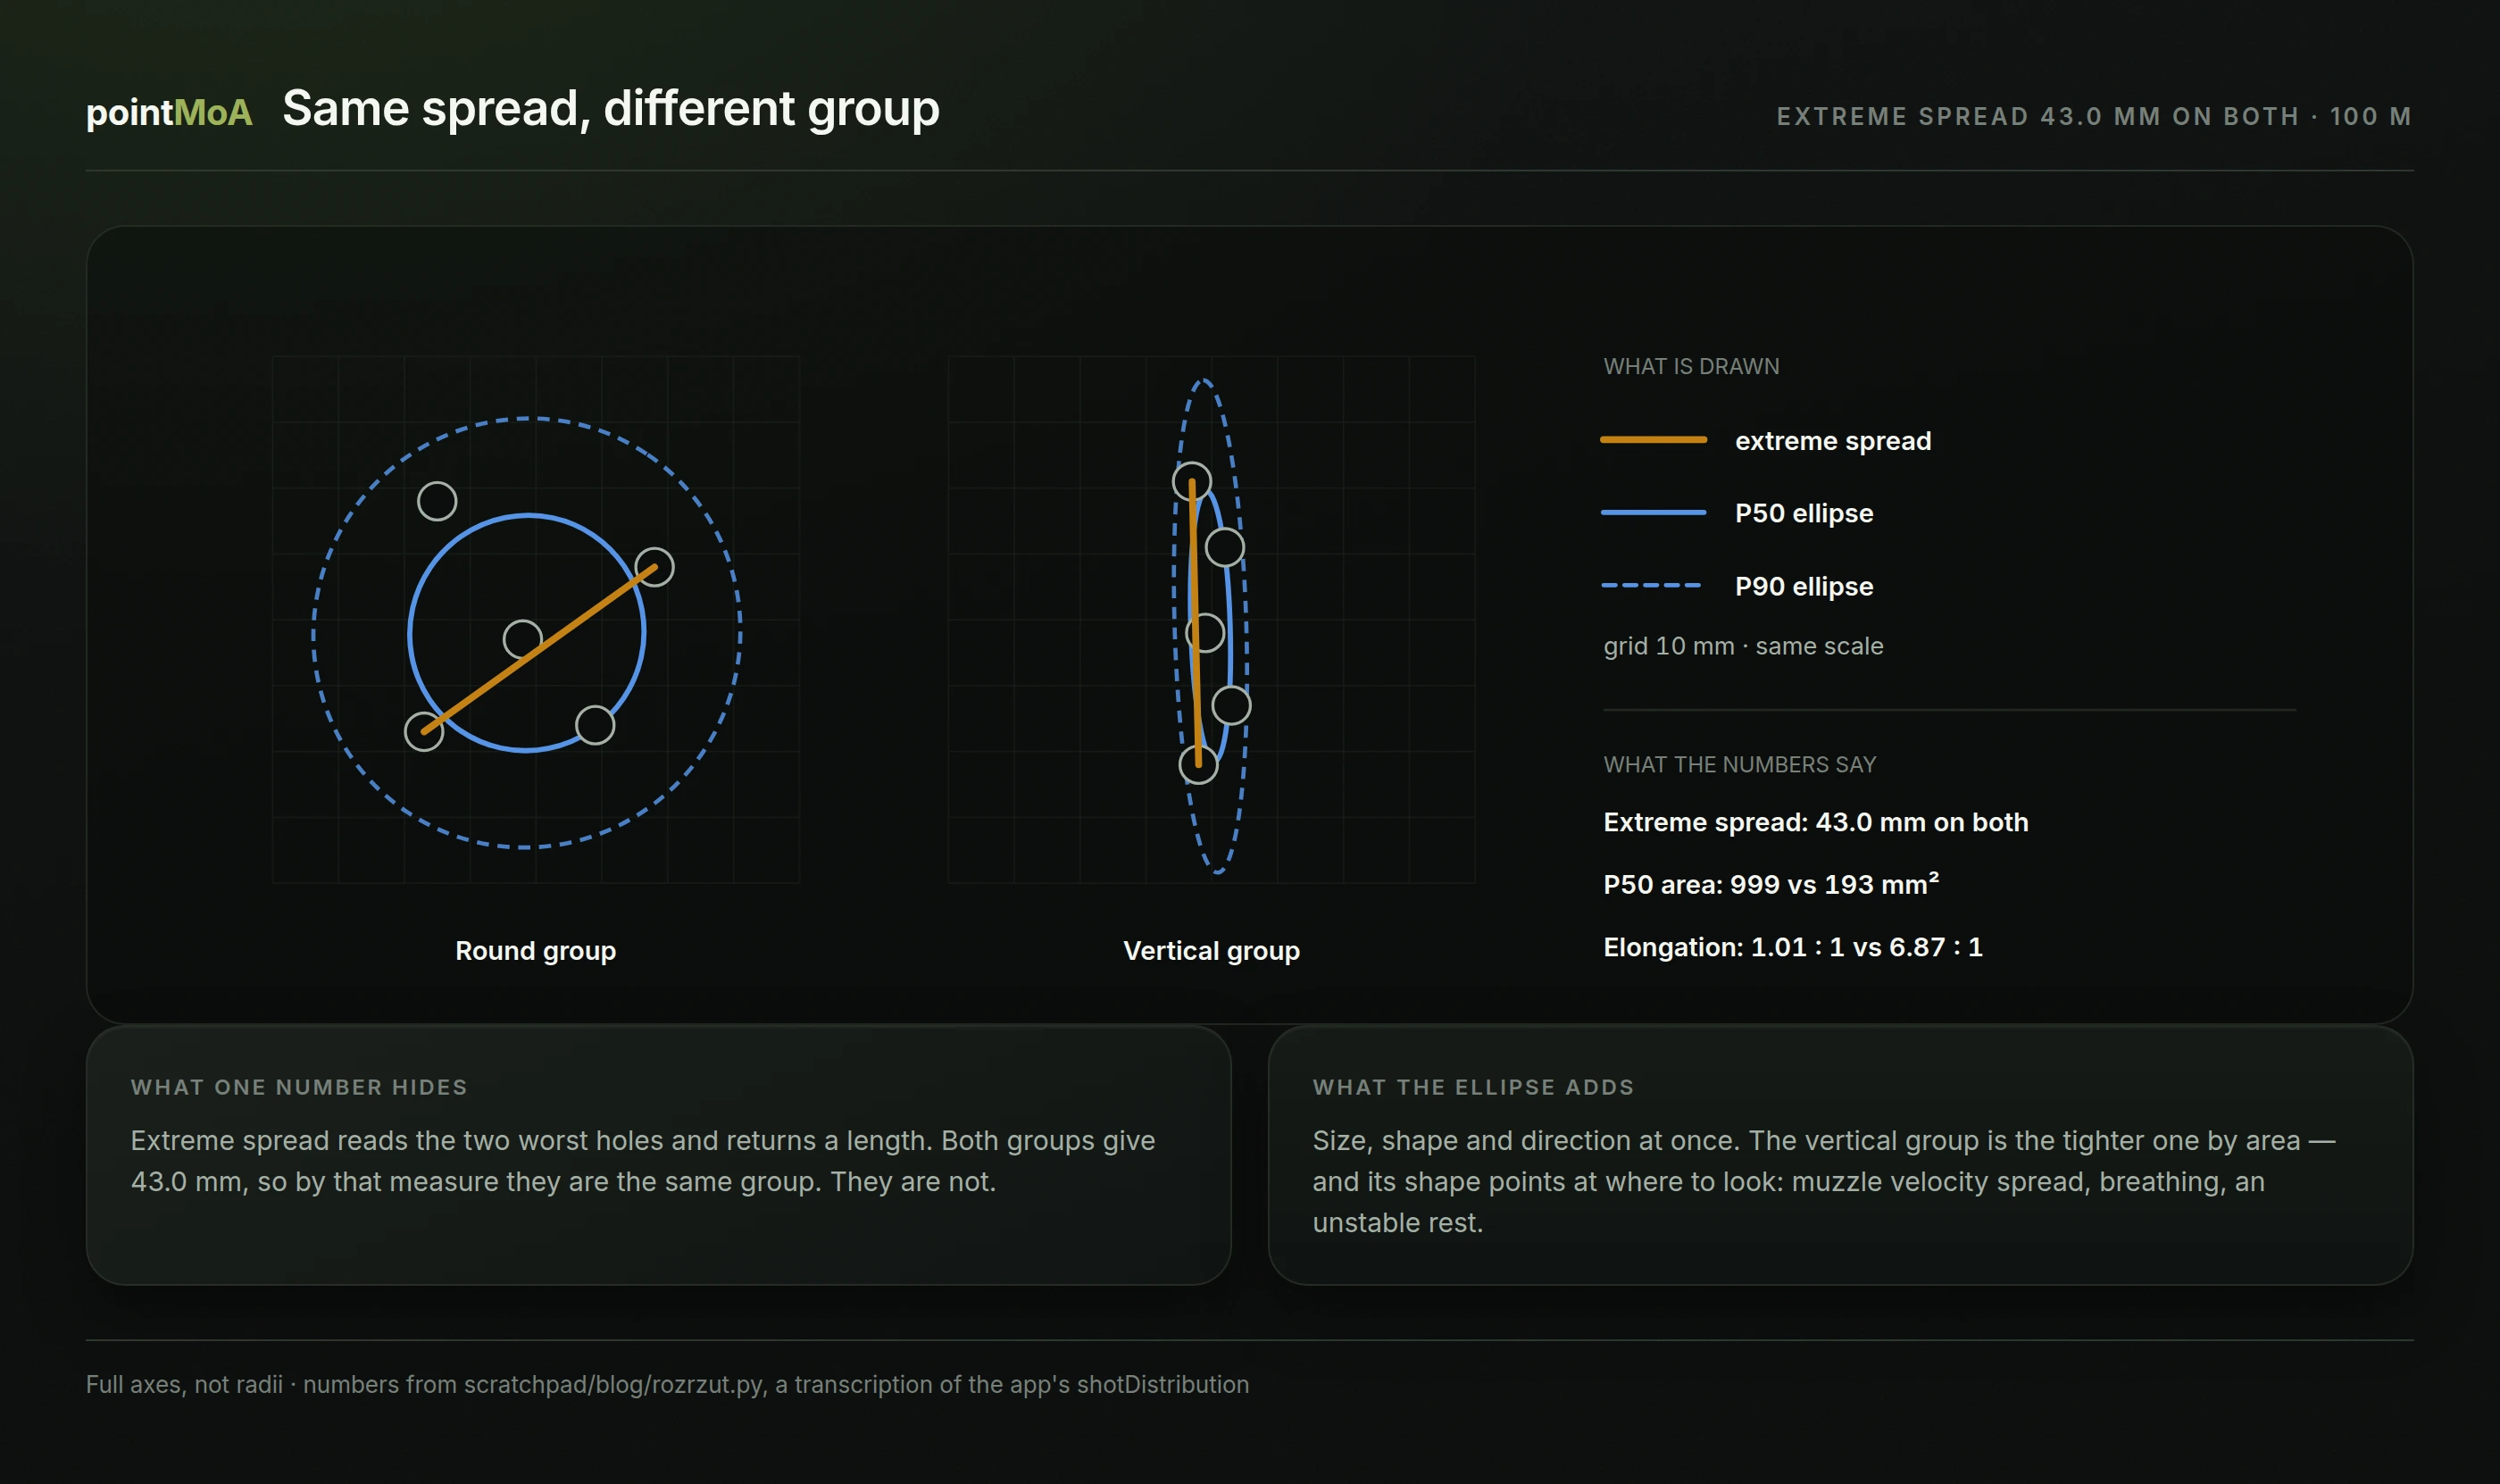
Extreme spread says the same thing about both. The ellipse says opposite things:
| Round group | Vertical group | |
|---|---|---|
| Extreme spread | 43.0 mm | 43.0 mm |
| Mean radius | 17.3 mm | 13.8 mm |
| P50 major axis | 35.9 mm | 41.0 mm |
| P50 minor axis | 35.4 mm | 6.0 mm |
| Elongation | 1.01 : 1 | 6.87 : 1 |
| Axis angle | 55.9° | 91.7° |
| P50 area | 999 mm² | 193 mm² |
The vertical group's P50 area is five times smaller. By the area the hits actually occupy it is the tighter group, despite the identical extreme spread. And its shape points at where to look for a cause: muzzle velocity spread, breathing, an unstable rest.
The two measures from the guide to measuring dispersion cannot say this. Extreme spread sees two shots; mean radius sees all of them, but only as distances — the direction is lost on the way.
P90 is always 1.82 times larger than P50
That is not a property of your group. It is a property of the model.
Both ellipses come from the same covariance matrix and differ only in the quantile, so the ratio of the axes is fixed:
√(4.605170 ÷ 1.386294) = 1.822616
and the ratio of the areas is exactly log₂10 = 3.321928. Always, for every group, every rifle, every distance.
The practical consequence: comparing P90 with P50 tells you nothing about your dispersion. If you are hunting for fliers, that ratio will not reveal them — it will only confirm that the app does its arithmetic correctly. A flier shows up on the target itself, or in both ellipse areas growing together.
Elongation and axis angle are shared between P50 and P90 as well; the app's own help text says so. The ellipses differ in size and in nothing else.
What P50 is not
This is worth spelling out, because other tools use neighbouring terms for different things.
- It is not a radius. The app reports full axes: 35.9 mm is the width of the ellipse edge to edge, not the distance from the centre. The help text on the major-axis field says exactly that.
- It is not CEP. Circular error probable is the radius of a circle containing half the hits. It assumes circular symmetry, which the vertical group above plainly lacks. An ellipse assumes nothing about shape — it reads the shape out of the data.
- It is not a percentile of measured distances. The app does not sort your hits by distance from the centre and take a median. It fits a distribution and computes the ellipse from its parameters. The difference shows: with three hits the P50 ellipse contains all three, because that is what the fit produces.
- It is not extreme spread or mean radius. For a perfectly circular distribution the P50 axis equals 1.88 mean radii, but that proportion holds only for a circular distribution and only in the many-shot limit.
How many hits it takes
The app refuses to fit an ellipse below three hits and flags the result as a small sample from three to nine. Both thresholds have a reason.
Below three points a two-dimensional ellipse does not exist: two points always lie on a line, so one of the eigenvalues is zero and the "ellipse" is a segment. The app returns no result rather than an ellipse of zero width.
Three hits are formally enough and can still be useless. Three holes on one line — an entirely possible outcome — give a minor axis of zero, an area of zero, and an elongation that cannot be computed; the app shows a dash.
Three hits have one more property worth knowing: the P50 ellipse always contains all three. Not because the group is good — because of the arithmetic. The transform that turns the fitted dispersion circular turns any triangle equilateral, so all three hits end up the same distance from the centre; that distance is exactly 4/3 in the units where the P50 boundary sits at 1.3863. The three always fit, with 4% to spare, whatever the shape of the group.
For a new, as yet unfired shot, that same ellipse contains it in 19% of cases, not 50%.
The circle that looks like an ellipse
This is the part that makes the small-sample warning worth respecting.
The four groups below are drawn from a perfectly circular distribution — one and the same, with a standard deviation of 15 mm. The true P50 ellipse of that distribution is a circle 35.3 mm across.
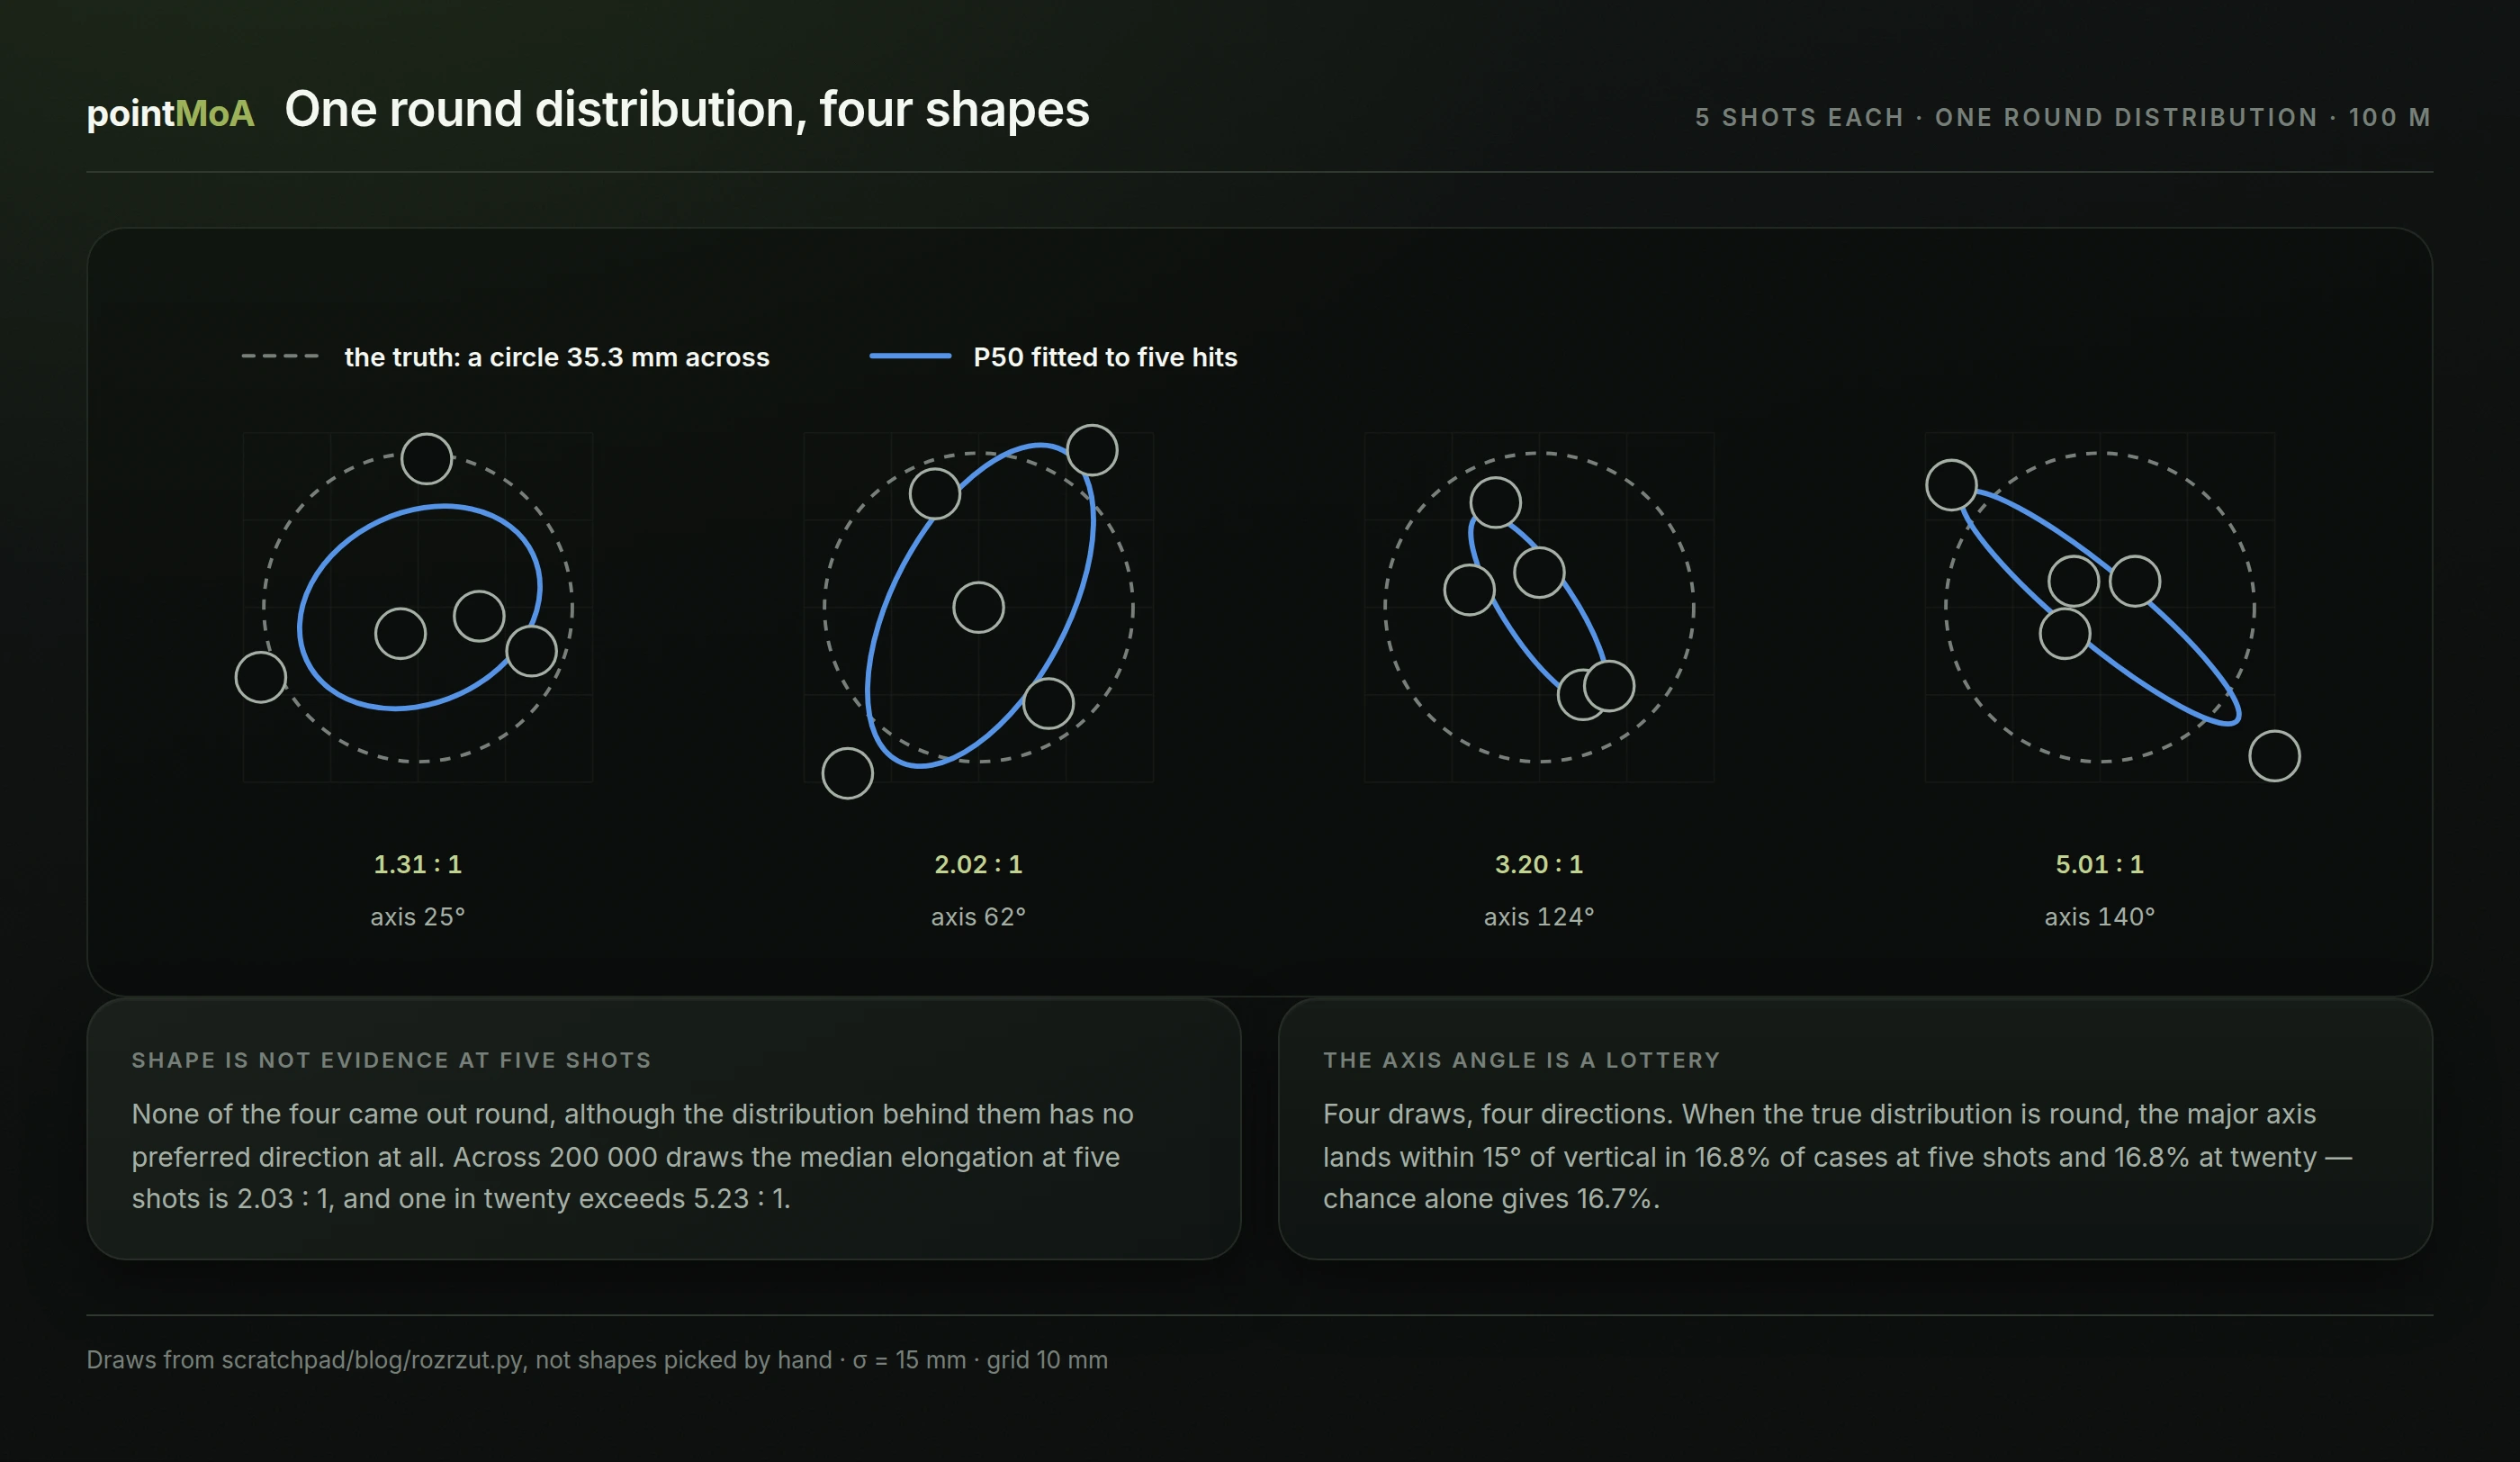
Not one of the four came out round. Elongations: 1.31 : 1, 2.02 : 1, 3.20 : 1 and 5.01 : 1. Axis angles: 25°, 62°, 124° and 140° — four different directions out of a distribution in which no direction is special at all.
We ran the numbers properly: 200,000 draws for each shot count, hits from a two-dimensional normal distribution with no preferred direction. The result is expressed as ratios, so it depends on neither calibre nor distance.
| Hits | Elongation: median | 95th percentile | P50 axis vs truth (median) | 10–90% band |
|---|---|---|---|---|
| 3 | 3.72 : 1 | 39.8 : 1 | 122% | 68–187% |
| 5 | 2.03 : 1 | 5.23 : 1 | 120% | 82–164% |
| 10 | 1.53 : 1 | 2.51 : 1 | 116% | 90–144% |
| 20 | 1.32 : 1 | 1.81 : 1 | 112% | 94–131% |
| 50 | 1.19 : 1 | 1.43 : 1 | 108% | 97–120% |
Read it like this: at five shots from a perfectly round distribution, the typical ellipse still looks twice as long as it is wide, and one in twenty looks more than five times as long. Only at fifty hits does the median fall to 1.19 : 1 — and still not to 1.00.
The same table says what the size of the ellipse is worth. At five shots the P50 major axis typically comes out 20% too large, and in one case in ten it exceeds 164% of the truth. At twenty the band narrows to 94–131%.
The axis angle is a lottery
If the distribution is circular, the direction of the major axis carries no information at all — and the simulation shows it to a tenth of a percent. The share of draws whose axis landed "vertical" (90° ± 15°):
- at 5 hits: 16.8%
- at 10 hits: 16.6%
- at 20 hits: 16.8%
Pure chance would give 16.7%, because a 30° window is one sixth of 180°. More hits change nothing here, because in a circular distribution there is nothing to detect.
This does not make the angle useless — it makes the angle useless until you have checked that the elongation itself is beyond chance. The app's help text puts it briefly: the angle alone does not diagnose shooting technique.
The elongation worth reading
The same simulation gives a working threshold. If your group's elongation exceeds the 95th percentile of a circular distribution, the shape is probably not an accident:
| Hits | "Probably not chance" (95th pct) | Stricter (99th pct) |
|---|---|---|
| 3 | 39.8 : 1 | 193 : 1 |
| 5 | 5.2 : 1 | 9.2 : 1 |
| 10 | 2.5 : 1 | 3.3 : 1 |
| 20 | 1.8 : 1 | 2.1 : 1 |
| 50 | 1.4 : 1 | 1.6 : 1 |
At three hits there is effectively no threshold — no elongation in the range a five-shot group produces is suspicious, because a circular distribution can deliver forty to one.
Back to the vertical group from the example: 6.87 : 1 at five shots. That is above the 5.2 : 1 threshold, so the signal is real — but modest. A perfectly circular distribution produces that shape in 2.3% of cases, roughly one group in forty-three. At ten hits the same elongation would be all but conclusive: 13 cases in 200,000.
How much actually falls inside
The names P50 and P90 describe the model, not a count of your hits. The gap is wide and grows as the sample shrinks. From the same simulation of a circular distribution:
| Hits | P50 covers hits from the same group | P50 covers a new shot | P90 covers a new shot |
|---|---|---|---|
| 3 | 100.0% | 18.9% | 39.4% |
| 5 | 43.3% | 31.7% | 63.6% |
| 10 | 48.2% | 40.8% | 78.4% |
| 20 | 49.3% | 45.4% | 84.6% |
| 50 | 49.8% | 48.1% | 87.9% |
Two things follow.
An ellipse from a small sample is too optimistic about the future. At five shots the ellipse labelled P90 contains a new shot 64% of the time, not 90%. Not because the model is wrong — because it is fitted to five points and inherits their randomness. The app's help says the same thing more briefly: the ellipses do not guarantee the next group.
The "same group" column is misleading. At three hits P50 contains the lot, which looks like a stellar result and is only a property of the arithmetic. From ten upward the figure converges on the expected 50%, and only then does it start to mean something.
Reading P50 over time
Ellipses track progress better than extreme spread does, because they use every hit. Three rules keep the comparison honest:
- Compare at the same hit count. A P50 axis from five shots is typically 20% too large; from fifty, 8%. A drop between sessions with different shot counts may be the sample alone.
- Compare at the same distance, or in MOA. The app shows both units side by side; millimetres at 300 m and at 100 m are not the same number. Converting is covered in the article on group size in MOA.
- Watch the area, not just the major axis. Area combines both axes into one number and cannot be fooled by a group that shortened vertically and spread horizontally.
The "Small sample" label beside a result is not decoration. It means precisely that the number under it comes from a range where the noise is often larger than the difference you are looking for.
Limits
- The model assumes a normal distribution. Hits from two different rifle settings, or two lots of ammunition, form a two-humped distribution that a single ellipse does not describe — only the heatmap will show it, because it assumes no shape.
- A flier moves both ellipses. Variance weights squared distances, so one distant shot counts heavily. The app does not discard outliers automatically, and rightly so — that is the shooter's call, not the algorithm's.
- The ellipses say nothing about the shift. They describe dispersion about its own centre, not the distance from that centre to your point of aim. That is a separate quantity and a separate article.
- Results must not be pooled across distances. The app enforces this itself — targets without a recorded distance stay out of the dispersion analysis.
The short version
- P50 and P90 are ellipses fitted to your hits, reported as full axes — not radii, not CEP.
- P90 is always 1.82 times P50 by axis and 3.32 times by area; that ratio says nothing about your group.
- The ellipse sees the shape and direction of the dispersion, which neither extreme spread nor mean radius can.
- At five shots a perfectly circular distribution typically yields a 2 : 1 ellipse, so "vertical stringing" in a small group is often an illusion.
- The ellipse labelled P90 contains a new shot 64% of the time at five hits and 88% at fifty.
Frequently asked questions
Is P50 the same as CEP? No. CEP is the radius of a circle and assumes the dispersion is circular. P50 in pointMoA is an ellipse with two axes, derived from the data. For an exactly circular distribution the two converge in area, but in every other case they describe different things.
Is 35.9 mm a radius or a diameter? A diameter — the full axis of the ellipse, edge to edge. The app reports axes rather than semi-axes and says so in the help text on that field.
Why is my ellipse elongated when my shooting feels even? Because at a small hit count it comes out elongated almost every time. The median at five shots, from a distribution with no preferred direction at all, is 2.03 : 1. Before you treat the shape as a symptom, check it at ten or twenty hits.
How many hits does P50 need to mean something? Three is the technical minimum, ten is where the app stops flagging a small sample, and twenty is the first count at which the P50 axis sits within 94–131% of the truth. For comparing ammunition, aim for twenty or more.
Does P90 reveal fliers? Not directly. P90 is always a fixed multiple of P50, so a flier enlarges both ellipses in the same proportion. Fliers show up on the target and in a sudden jump in both areas against previous sessions.
Does the P50 ellipse contain half my hits? Usually about half, but not exactly and not always. At three hits it contains them all, at five 43% on average, at fifty 49.8%. It is a model fit, not a count.
Turn on the additional analysis in the pointMoA log, mark at least three hits and give the target a distance — the app will compute axes, area, elongation and angle for both ellipses, in millimetres and MOA, and flag the result itself when the sample is too small. More about the app.